I suddenly wondered how it would affect the binary log of bulk row update queries.
For example, if a table of several tens of giga-bytes is updated at once, and single update row event is sent, OOM will occur in the target database. Extremely dangerous.
How to handle this in MySQL, let’s talk lightly.
Bulk row update
In MySQL, the data actually written to the DB for the Insert query is written to the binlog as it is.
If you use a syntax like insert into .. select .. All of these data are recorded in the binlog in the form of an Array. This means that multiple rows are written to one write row event.
So, using mysql-binlog-connector-java , I simply printed out the row count applied to WriteRowsEvent and UpdateRowsEvent. Each event is passed in the form of or in the data area.
Each event is passed in the form of <Serializable[]> or <Serializable[],Serializable[]> in the data area.
Interestingly, up to 16 rows cases are transmitted as write rows events as intended. From 32 rows case, two write rows events are transmitted. As a result, it is divided into approximately 25 pieces.
mysql> update binlog_test set v = repeat(md5(rand()), 10);
This time, approximately 12 rows are included in single update rows event. This is because the update rows event includes additional before content (this format <Serializable[],Serializable[]>).
If you roughly calculate this size, it is calculated to be about 8K. This is calculated by --binlog-row-event-max-size. And Variable 'binlog_row_event_max_size' is a read only variable, so you need to add in my.cnf before startup mysql server.
Specify the maximum size of a row-based binary log event, in bytes. Rows are grouped into events smaller than this size if possible. The value should be a multiple of 256. The default is 8192.
binlog_row_event_max_size
You might ask if one operation is unstable if data is split and passed in this way. However, in binlog, it is recorded in the binlog in the form below and data is processed.
In other words, there is no problem because data is processed in a single transaction.
This is something I checked out of personal curiosity. Since the case of using binlog is frequent, this content is meaningful for me.
In a situation where a single row exceeds 8k, if 5-6 rows are frequently updated at a time, binlog data can be received efficiently by adjusting binlog_row_event_max_size upward.
Each time only a single update rows event is delivered on default 8k binlog_row_event_max_size, one update rows event will be delivered as an array. (Of course, as long as memory allows.)
In this post, I will talk about MySQL InnoDB Memcached plugin.
Although there are many other posts about this kind of subject, I focus on the goal of applying the actual service. It also contains its own philosophy of manipulating the flow of data well.
So, Let’s start about this subject!
Cache layer?
As the traffic of the service increases to the level of a monster, it is difficult to service with the DB only.
Of course, most of the small and medium-sized data could be served with only single database, but in the case of giga-unit traffic, there is a performance limit to get static data that does not change from the Database every time.
More than anything! Database has limited resources, it is true that all monster traffic cannot be handled based on DB only.
So, in the past when disk I/O was not good, I remember processing frequently searched data with a memory DB such as ALTIBASE Database which is memory based in order to provide service for this processing.
There are many purposes of the cache layer, but I would like to highlight for two cases which are as below;
Queuing or preprocessing in cache and write to file asynchronously.
Deliver service after loading data with high frequency of inquiry but little change in memory.
The latter is what I will be talking about here, the frequency of inquiry is very high but little change.
I add one additional option, it can be said that it is a really interesting story for the requirement to show only the data that has been processed and completed. (like READ-COMMITTED!!)
MySQL Memcached plugin
There are many different cache stores, but the reason I was interested in the MySQL memcached plugin is simple.
It’s accessible InnoDB data directly, without query parsing and optimizer steps. In the past, I was interested in MariaDB with a concept similar to HandlerSocket.
Oh, of course, it’s possible allocate and use a separate cache memory control the memcached policy in MySQL, but in an environment where there is a device with superior random I/O than expected, such as SSD, and we have already cache memory area, InnoDB buffer pool.
It didn’t really appeal to my point of view. (Of course, since InnoDB is a B-Tree, you cannot compare the performance itself with a hash structure that normally looks up data in O(1).)
Direct access to InnoDB data? This story can also be interpreted differently as non-volatile caching layer. That is, a caching layer with infinite TTL that does not have an expire time separately!! I could see new possibilities.
Configuration
You may refer to the Oracle documentation (innodb-memcached-setup), but today, I will configure the memcached plugin based only on the purpose of using the memcache protocol.
First, configure the schema related to memcached as shown below to configure the InnoDB plugin. 🙂 Here, $MYSQL_HOME means the home directory where MySQL is installed, and it will vary depending on each system configuration environment.
$ mysql -uroot < $MYSQL_HOME/share/innodb_memcached_config.sql
I will set up a separate token table as shown below.
After going through this process, an environment that can directly access DB data using the memcached protocol. “11211 port” has been opened as the default port, and you can get data directly from InnoDB data area by performing get operation with memcache protocol through this port.
In other words, you can directly read the changed data with SQL. (You can create a VALUE of memcache by mapping table columns to delimiters, but we will skip them here.)
Performance
Non-volatile caching layer? Of course, performance is a concern. No matter how good the expectations are, it is not a good solution if the response time or stability is poor in a caching system that generates a huge amount of reads. So, I compared the speed of InnoDB data lookup through a simple PK-based single lookup query and the memcached protocol.
Let’s configure the environment for a simple performance test. First, create a test table as shown below and create about 1 million data for performance testing.
## Generate test data
mysql> insert ignore into token
    -> select md5(rand()), concat(uuid(), md5(rand())) from dual;
mysql> insert ignore into token
    -> select md5(rand()), concat(uuid(), md5(rand())) from token;
... repeat ...

mysql> select count(*) from token;
+----------+
| count(*) |
+----------+
|   950435 |
+----------+
I did a simple test. SQL vs memcached!!
## SQL ##
SELECT * FROM token WHERE id = ${id}

## Memcache ##
get @@token.${id}
Based on the total ID value of the generated data, the system resources were measured by performing approximately 70,000 queries per second for each of the queries in the following random pattern.
In order to even evaluate the stability, I gave a stress test with continuous traffic of 70,000 per second for about 10 days. As a result, no error occurred even at once, and it showed a response time of about 0.3ms to 0.5ms each operation. About 1 second, the response time was only 1.5ms. (For reference, the right side is the interval average seconds.)
At this level, it is at a level that can be used as a cache in production. 🙂
I even gave 140,000 GET operation stress per second. There was no problem with the service at all, and the average CPU resource utilization was about at 15%.. it was in a very stable state. Amazing!
Monitoring
No matter how great the service is, if there is no tool to check the health status of this service in real time, it will be useless, right? So, either way, I need to find the most effective monitoring method. Personally, I prefer to collect metrics using prometheus.
The reason I prefer prometheus is simple.
There are so many exporters that have already been made, and that if I want something, I can easily access it by adding functions to suit my own taste! The fact that I can collect monitoring metric information really efficiently with Prometheus, a time-series-based data store!
It is no exaggeration to say that Prometheus is optimized for metric collection.
Of course, in the case of the memcached exporter officially released by Prometheus, there are some problems in collecting InnoDB memcached information. The data of more than 4 characters in the stats settings result is recognized as an abnormal pattern, and memcached is collected as not running normally. If there is something that doesn’t work, I just fix it. It’s an open source fun factor.
// AS-IS ======================
stats := map[string]string{}
for err == nil && !bytes.Equal(line, resultEnd) {
    s := bytes.Split(line, []byte(" "))
    if len(s) != 3 || !bytes.HasPrefix(s[0], resultStatPrefix) {
        return fmt.Errorf("memcache: unexpected stats line format %q", line)
    }
    stats[string(s[1])] = string(bytes.TrimSpace(s[2]))
    line, err = rw.ReadSlice('\n')
    if err != nil {
        return err
    }
}

// TO-BE ======================
stats := map[string]string{}
for err == nil && !bytes.Equal(line, resultEnd) {
    s := bytes.Split(line, []byte(" "))
    if len(s) == 3 {
        stats[string(s[1])] = string(bytes.TrimSpace(s[2]))
    } else if len(s) == 4 {
        stats[string(s[1])] = string(bytes.TrimSpace(s[2])) + "-" + string(bytes.TrimSpace(s[2]))
    } else {
        return fmt.Errorf("memcache: unexpected stats line format %q", line)
    }
    line, err = rw.ReadSlice('\n')
    if err != nil {
        return err
    }
}
By simply modifying a few lines, this unusual processing was easily resolved.
From now on, I can collect metrics and send alerts through prometheus, and check real-time metrics through Grafana! I’ve got a powerful monitoring tool.
Beyond physical memory
With only the contents listed above, it is absolutely perfect for production use as a cache layer.
However, I imagined possibilities beyond this.
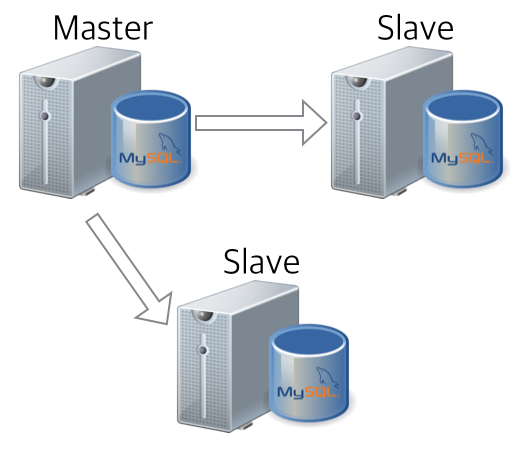
As you all know, one of the powerful features of MySQL is data replication. If you reliably replicate master data through replication and utilize it well for services, you can naturally induce READ distribution as shown below. 🙂
Since all nodes have the same data, the same result is obtained no matter which device reads the data. In other words, as shown in the figure above, cache data is normally serviced for each group, but in case of a specific node failure, there is no service problem at all, even if data is pulled from another nearby MySQL.
Moreover, since each application reads as much data as needed, there is no reason to include all replicated data in the InnoDB buffer pool. In other words, non-volatile cache data that does not disappear is naturally distributed and serviced.
One more thing! If you take advantage of MySQL replication well, you can’t miss binary logs. Binary log is a file that stores the history of data changes in MySQL and has a role of replicating this data by replaying it as it is in the slave (applying the changed history in the master as it is).
In the case of ROW format, the changed data content itself is included. In the case of FULL image, all data before and after the change is included, so you can think of an interesting CDC structure for caching as shown below.
When data changes occur in tables related to caching (such as member information) in the MySQL Master DB where data changes occur, it is possible to create a replicator that detects and converts data into JSON format and puts data into cache of MySQL.
If this happens, the left service (red) DB is converted into JSON as natural as flowing water without any manipulation and is stored as a non-volatile caching layer. Then, the application can perform asynchronous caching service based on the data converted to JSON.
Of course, I talked this easily here, but it will require a lot of defense logic to deal with many side effects such as replication delay.
Conclusion
I do not think that what I have talked about this topic so far is the best solution for each service.
However, alternatives such as InnoDB memcached plugin were able to present a fairly suitable solution in the current problem situation, and I wanted to talk about the process of thinking about new possibilities by harmonizing this with MySQL’s unique function.
The goal is not to have a system without failures, but to create a robust system with a low probability of failure, a system that can be restored quickly even if it fails!!
In order to do that, I wanted to take this opportunity to solve my own solutions that I imagined by combining the good functions of each system well. 🙂
Hi, it’s too hot summer in Korea. Today I want to talk about an interesting and exciting topic. Try to making your own exporter in Go language.
If you register a specific query, it is a simple program that shows the result of this query as an exporter result metrics. Some of you may still be unfamiliar with what Expoter is.
I will explain about Exporter step by step in today’s post.
Exporter?
You can think of an Exporter as an HTTP server for pulling data from a time series database like Prometheus. Prometheus periodically calls the specific URL of the exporter and saves the result of metrics as a time series.
There are many exporters exist in the everywhere.
Typically, there is mysqld_expoter, which is Prometheus’s Offcial projects, and mysqld_expoter, which they fork and distribute additionally in Percona. Besides these, not only node_expoter for monitoring Linux nodes, but also memcached_expoter etc..
What I am going to present my Blog that is the process of adding my own new exporter among these various exporters. Let’s go!
Creating a Go project
Exporter can be implemented in various languages, but today I will implement it with Go.
Personally, I think Go is very convenient in terms of distribution and compatibility. I will omit the go installation and environment configuration here.
$ cd ~/go/src

$ mkdir -p query-exporter-simple

$ cd query-exporter-simple

$ go mod init
go: creating new go.mod: module query-exporter-simple

$ ls -al
total 8
drwxr-xr-x   3 chan  staff   96  7 12 13:33 .
drwxr-xr-x  12 chan  staff  384  7 12 13:33 ..
-rw-r--r--   1 chan  staff   38  7 12 13:33 go.mod

$ cat go.mod
module query-exporter-simple

go 1.16
Although it is an fundamental project, now everything is ready to make your own exporter. From now on, package management is managed with “go mod”.
Try Empty Exporter
Now, let’s start making the Exporter in earnest.
First, as a taster, let’s try to make an empty Exporter that has no function.. it simply outputs the exporter version only.
This is to read OS parameters using flags. The “bind” is server HTTP binding information when Exporter is started.
package main

import (
    "flag"
)

func main() {
    // =====================
    // Get OS parameter
    // =====================
    var bind string
    flag.StringVar(&bind, "bind", "0.0.0.0:9104", "bind")
    flag.Parse()
}
Register Collector to collect and run Exporter with HTTP server. Collector is the concept of a thread that collects information, and it implements the Collector interface of Prometheus.
package main

import (
    "flag"
    "net/http"

    "github.com/prometheus/client_golang/prometheus"
    "github.com/prometheus/client_golang/prometheus/promhttp"
    "github.com/prometheus/common/version"
    log "github.com/sirupsen/logrus"
)

func main() {
    // =====================
    // Get OS parameter
    // =====================
    var bind string
    flag.StringVar(&bind, "bind", "0.0.0.0:9104", "bind")
    flag.Parse()

    // ========================
    // Regist handler
    // ========================
    prometheus.Register(version.NewCollector("query_exporter"))

    // Regist http handler
    http.HandleFunc("/metrics", func(w http.ResponseWriter, r *http.Request) {
        h := promhttp.HandlerFor(prometheus.Gatherers{
            prometheus.DefaultGatherer,
        }, promhttp.HandlerOpts{})
        h.ServeHTTP(w, r)
    })

    // start server
    log.Infof("Starting http server - %s", bind)
    if err := http.ListenAndServe(bind, nil); err != nil {
        log.Errorf("Failed to start http server: %s", err)
    }
 }
Since the packages used by source code do not exist in the project yet, numerous errors will be occurred.
So, as below, get related packages through “go mod vendor”. Related packages are placed under the vendor directory.
$ go mod vendor
go: finding module for package github.com/prometheus/common/version
go: finding module for package github.com/prometheus/client_golang/prometheus
go: finding module for package github.com/sirupsen/logrus
go: finding module for package github.com/prometheus/client_golang/prometheus/promhttp
go: found github.com/prometheus/client_golang/prometheus in github.com/prometheus/client_golang v1.11.0
go: found github.com/prometheus/client_golang/prometheus/promhttp in github.com/prometheus/client_golang v1.11.0
go: found github.com/prometheus/common/version in github.com/prometheus/common v0.29.0
go: found github.com/sirupsen/logrus in github.com/sirupsen/logrus v1.8.1

$ ls -al
total 112
drwxr-xr-x   6 chan  staff    192  7 13 10:26 .
drwxr-xr-x  12 chan  staff    384  7 12 13:33 ..
-rw-r--r--   1 chan  staff    169  7 13 10:26 go.mod
-rw-r--r--   1 chan  staff  45722  7 13 10:26 go.sum
-rw-r--r--   1 chan  staff   1163  7 13 10:34 main.go
drwxr-xr-x   6 chan  staff    192  7 13 10:26 vendor
If you start the Exporter server, the server will be run on port 9104 (the port specified by default in flag).
$ go run .
INFO[0000] Regist version collector - query_exporter
INFO[0000] HTTP handler path - /metrics
INFO[0000] Starting http server - 0.0.0.0:9104
If you want to change the port, give the bind OS parameter as below, then, the server will run with that port.
$ go run . --bind=0.0.0.0:9105
INFO[0000] Regist version collector - query_exporter
INFO[0000] HTTP handler path - /metrics
INFO[0000] Starting http server - 0.0.0.0:9105
Even though it is an empty Exporter.. You can see that a lot of information is extracted through the Exporter. (Most of the information is about go itself..)
$ curl 127.0.0.1:9104/metrics
# HELP go_gc_duration_seconds A summary of the pause duration of garbage collection cycles.
# TYPE go_gc_duration_seconds summary
go_gc_duration_seconds{quantile="0"} 0
go_gc_duration_seconds{quantile="0.25"} 0

.. skip ..

# HELP go_threads Number of OS threads created.
# TYPE go_threads gauge
go_threads 7
# HELP query_exporter_build_info A metric with a constant '1' value labeled by version, revision, branch, and goversion from which query_exporter was built.
# TYPE query_exporter_build_info gauge
query_exporter_build_info{branch="",goversion="go1.16.5",revision="",version=""} 1
At the very bottom, there is the query_exporter_build_info metric, which is the information collected by the Collector that we added in the previous section. This is the moment we created the new Exporter collecting version information!
Creating an Exporter in earnest
I made an empty Exporter that specifies only the exporter version. Is that easy, right? 🙂
From now on, I’m going to implement a Collector that collects the information we really need from database and sends the result to the HTTP GET method.
1. Configuration format (YAML)
As I said before, I want to make something that passes the result of the registered query to the Exporter result metric. To do this, you need to know information about the target instance as well as the query to be executed.
Let’s set it up in the below format. MySQL connection information and the query to be executed. It will show two pieces of information as a result: “Connections per host” and “Connections per user”.
dsn: test:test123@tcp(127.0.0.1:3306)/information_schema
metrics:
  process_count_by_host:
    query: "select user,
                  substring_index(host, ':', 1) host,
                  count(*) sessions
            from information_schema.processlist
            group by 1,2 "
    type: gauge
    description: "process count by host"
    labels: ["user","host"]
    value: sessions
  process_count_by_user:
    query: "select user, count(*) sessions
            from information_schema.processlist
            group by 1 "
    type: gauge
    description: "process count by user"
    labels: ["user"]
    value: sessions
I tried defining the above yaml as Go structure.
type Config struct {
    DSN     string
    Metrics map[string]struct {
        Query       string
        Type        string
        Description string
        Labels      []string
        Value       string
        metricDesc  *prometheus.Desc
    }
}
Here, metricDesc *prometheus.Desc can be understood as a specification used in Prometheus metrics. It also specifies any label and metric types such as Counter/Gauge.
Read the YAML file as below, and finally load the setting information into the structure defined below.
var b []byte
var config Config
if b, err = ioutil.ReadFile("config.yml"); err != nil {
    log.Errorf("Failed to read config file: %s", err)
    os.Exit(1)
}

// Load yaml
if err := yaml.Unmarshal(b, &config); err != nil {
    log.Errorf("Failed to load config: %s", err)
    os.Exit(1)
}
In this way, we can now put the necessary information in the Config structure and use it to implement the desired implementation.
package main

import (
    "flag"
    "io/ioutil"
    "net/http"
    "os"

    "github.com/ghodss/yaml"
    "github.com/prometheus/client_golang/prometheus"
    "github.com/prometheus/client_golang/prometheus/promhttp"
    "github.com/prometheus/common/version"
    log "github.com/sirupsen/logrus"
)

var config Config

func main() {
    var err error
    var configFile, bind string
    // =====================
    // Get OS parameter
    // =====================
    flag.StringVar(&configFile, "config", "config.yml", "configuration file")
    flag.StringVar(&bind, "bind", "0.0.0.0:9104", "bind")
    flag.Parse()

    // =====================
    // Load config & yaml
    // =====================
    var b []byte
    if b, err = ioutil.ReadFile(configFile); err != nil {
        log.Errorf("Failed to read config file: %s", err)
        os.Exit(1)
    }

    // Load yaml
    if err := yaml.Unmarshal(b, &config); err != nil {
        log.Errorf("Failed to load config: %s", err)
        os.Exit(1)
    }

    // ========================
    // Regist handler
    // ========================
    log.Infof("Regist version collector - %s", "query_exporter")
    prometheus.Register(version.NewCollector("query_exporter"))

    // Regist http handler
    log.Infof("HTTP handler path - %s", "/metrics")
    http.HandleFunc("/metrics", func(w http.ResponseWriter, r *http.Request) {
        h := promhttp.HandlerFor(prometheus.Gatherers{
            prometheus.DefaultGatherer,
        }, promhttp.HandlerOpts{})
        h.ServeHTTP(w, r)
    })

    // start server
    log.Infof("Starting http server - %s", bind)
    if err := http.ListenAndServe(bind, nil); err != nil {
        log.Errorf("Failed to start http server: %s", err)
    }
}

// =============================
// Config config structure
// =============================
type Config struct {
    DSN     string
    Metrics map[string]struct {
        Query       string
        Type        string
        Description string
        Labels      []string
        Value       string
        metricDesc  *prometheus.Desc
    }
}
2. Implement Collector
The highlight of today’s post is the implementing a Collector to collect the desired information from database.
All the processes I implemented so far is to get the results as an HTTP result. Collector actually connect to the database and delivering the specified metric result based on the result of executing the specified query.
type QueryCollector struct{}

// Describe prometheus describe
func (e *QueryCollector) Describe(ch chan<- *prometheus.Desc) {
}

// Collect prometheus collect
func (e *QueryCollector) Collect(ch chan<- prometheus.Metric) {
}
As I have mentioned earlier, Collector is kind of a thread concept that collects information, and is a structure that implements the Collector interface of Prometheus. In other words, this story means that if you want to create another Collector of your own, you must implement two of the Describe and Collect defined by the prometheus.Collector interface.
The Version Collector added to the can exporter created earlier and the QueryCollector newly added this time are registered. When an http request comes in to “/metric”, the above two Collectors are finally executed by each thread.
2-1. Create the Describe function
This is the part that defines the specifications of each metric. Actually, it is not necessary to define the specification of the metric here, but it is useful if you consider the case of creating and operating multiple Collectors. This method is executed only once when a Collector is registered with prometheus.Register.
func (e *QueryCollector) Describe(ch chan<- *prometheus.Desc) {
    for metricName, metric := range config.Metrics {
        metric.metricDesc = prometheus.NewDesc(
            prometheus.BuildFQName("query_exporter", "", metricName),
            metric.Description,
            metric.Labels, nil,
        )
        config.Metrics[metricName] = metric
        log.Infof("metric description for \"%s\" registerd", metricName)
    }
}
Here, I have defined the specification of the metric with the information related to Query in the setting information read earlier.
prometheus.BuildFQName: name of metric
metric.Description: Description
metric.Labels: Array of label names, label values should be mapped later in this order
If you look at the config.yml, each mapping will be as follows.
This is the part that connects to the DB, executes the registered SQL, and makes it a metric.
The execution results(rows) of each query are displayed as a metric name and values as shown in the figure above.
func (e *QueryCollector) Collect(ch chan<- prometheus.Metric) {

    // Connect to database
    db, err := sql.Open("mysql", config.DSN)
    if err != nil {
        log.Errorf("Connect to database failed: %s", err)
        return
    }
    defer db.Close()

    // Execute each queries in metrics
    for name, metric := range config.Metrics {

        // Execute query
        rows, err := db.Query(metric.Query)
        if err != nil {
            log.Errorf("Failed to execute query: %s", err)
            continue
        }

        // Get column info
        cols, err := rows.Columns()
        if err != nil {
            log.Errorf("Failed to get column meta: %s", err)
            continue
        }

        des := make([]interface{}, len(cols))
        res := make([][]byte, len(cols))
        for i := range cols {
            des[i] = &res[i]
        }

        // fetch database
        for rows.Next() {
            rows.Scan(des...)
            data := make(map[string]string)
            for i, bytes := range res {
                data[cols[i]] = string(bytes)
            }

            // Metric labels
            labelVals := []string{}
            for _, label := range metric.Labels {
                labelVals = append(labelVals, data[label])
            }

            // Metric value
            val, _ := strconv.ParseFloat(data[metric.Value], 64)

            // Add metric
            switch strings.ToLower(metric.Type) {
            case "counter":
                ch <- prometheus.MustNewConstMetric(metric.metricDesc, prometheus.CounterValue, val, labelVals...)
            case "gauge":
                ch <- prometheus.MustNewConstMetric(metric.metricDesc, prometheus.GaugeValue, val, labelVals...)
            default:
                log.Errorf("Fail to add metric for %s: %s is not valid type", name, metric.Type)
                continue
            }
        }
    }
}
As you can see from the labelVals value, you need to pass the label values in the order of Labels of the specification defined in Describe earlier. There are two metric types here: counter and gauge. Each type has the following meaning.
COUNTER: A value that only increases. In prometheus, the indicator is displayed as a change calculation function such as rate/irate.
GAUGE: A type whose value can increase/decrease, such as like car gauge. In general, it is used to save the current metric value as it is, such as process count.
For the value to be displayed as a metric, the value item specified in the setting is retrieved from the query result.
QueryExporter Source
Here’s the everything that I’ve done so far:
package main

import (
    "database/sql"
    "flag"
    "io/ioutil"
    "net/http"
    "os"
    "strconv"
    "strings"

    "github.com/ghodss/yaml"
    _ "github.com/go-sql-driver/mysql"
    "github.com/prometheus/client_golang/prometheus"
    "github.com/prometheus/client_golang/prometheus/promhttp"
    "github.com/prometheus/common/version"
    log "github.com/sirupsen/logrus"
)

var config Config

const (
    collector = "query_exporter"
)

func main() {
    var err error
    var configFile, bind string
    // =====================
    // Get OS parameter
    // =====================
    flag.StringVar(&configFile, "config", "config.yml", "configuration file")
    flag.StringVar(&bind, "bind", "0.0.0.0:9104", "bind")
    flag.Parse()

    // =====================
    // Load config & yaml
    // =====================
    var b []byte
    if b, err = ioutil.ReadFile(configFile); err != nil {
        log.Errorf("Failed to read config file: %s", err)
        os.Exit(1)
    }

    // Load yaml
    if err := yaml.Unmarshal(b, &config); err != nil {
        log.Errorf("Failed to load config: %s", err)
        os.Exit(1)
    }

    // ========================
    // Regist handler
    // ========================
    log.Infof("Regist version collector - %s", collector)
    prometheus.Register(version.NewCollector(collector))
    prometheus.Register(&QueryCollector{})

    // Regist http handler
    log.Infof("HTTP handler path - %s", "/metrics")
    http.HandleFunc("/metrics", func(w http.ResponseWriter, r *http.Request) {
        h := promhttp.HandlerFor(prometheus.Gatherers{
            prometheus.DefaultGatherer,
        }, promhttp.HandlerOpts{})
        h.ServeHTTP(w, r)
    })

    // start server
    log.Infof("Starting http server - %s", bind)
    if err := http.ListenAndServe(bind, nil); err != nil {
        log.Errorf("Failed to start http server: %s", err)
    }
}

// =============================
// Config config structure
// =============================
type Config struct {
    DSN     string
    Metrics map[string]struct {
        Query       string
        Type        string
        Description string
        Labels      []string
        Value       string
        metricDesc  *prometheus.Desc
    }
}

// =============================
// QueryCollector exporter
// =============================
type QueryCollector struct{}

// Describe prometheus describe
func (e *QueryCollector) Describe(ch chan<- *prometheus.Desc) {
    for metricName, metric := range config.Metrics {
        metric.metricDesc = prometheus.NewDesc(
            prometheus.BuildFQName(collector, "", metricName),
            metric.Description,
            metric.Labels, nil,
        )
        config.Metrics[metricName] = metric
        log.Infof("metric description for \"%s\" registerd", metricName)
    }
}

// Collect prometheus collect
func (e *QueryCollector) Collect(ch chan<- prometheus.Metric) {

    // Connect to database
    db, err := sql.Open("mysql", config.DSN)
    if err != nil {
        log.Errorf("Connect to database failed: %s", err)
        return
    }
    defer db.Close()

    // Execute each queries in metrics
    for name, metric := range config.Metrics {

        // Execute query
        rows, err := db.Query(metric.Query)
        if err != nil {
            log.Errorf("Failed to execute query: %s", err)
            continue
        }

        // Get column info
        cols, err := rows.Columns()
        if err != nil {
            log.Errorf("Failed to get column meta: %s", err)
            continue
        }

        des := make([]interface{}, len(cols))
        res := make([][]byte, len(cols))
        for i := range cols {
            des[i] = &res[i]
        }

        // fetch database
        for rows.Next() {
            rows.Scan(des...)
            data := make(map[string]string)
            for i, bytes := range res {
                data[cols[i]] = string(bytes)
            }

            // Metric labels
            labelVals := []string{}
            for _, label := range metric.Labels {
                labelVals = append(labelVals, data[label])
            }

            // Metric value
            val, _ := strconv.ParseFloat(data[metric.Value], 64)

            // Add metric
            switch strings.ToLower(metric.Type) {
            case "counter":
                ch <- prometheus.MustNewConstMetric(metric.metricDesc, prometheus.CounterValue, val, labelVals...)
            case "gauge":
                ch <- prometheus.MustNewConstMetric(metric.metricDesc, prometheus.GaugeValue, val, labelVals...)
            default:
                log.Errorf("Fail to add metric for %s: %s is not valid type", name, metric.Type)
                continue
            }
        }
    }
}
If the package does not exist, run “go mod vendor” to download the necessary packages.
Start the server and check the information collected by the actual exporter.
$ go run .
INFO[0000] Regist version collector - query_exporter
INFO[0000] metric description for "process_count_by_host" registerd
INFO[0000] metric description for "process_count_by_user" registerd
INFO[0000] HTTP handler path - /metrics
INFO[0000] Starting http server - 0.0.0.0:9104
If you run it with curl, you can see that the session count per user/host defined in the settings is displayed.
$ curl 127.0.0.1:9104/metrics
# HELP go_gc_duration_seconds A summary of the pause duration of garbage collection cycles.
# TYPE go_gc_duration_seconds summary
go_gc_duration_seconds{quantile="0"} 0
go_gc_duration_seconds{quantile="0.25"} 0

.. skip ..

# HELP query_exporter_build_info A metric with a constant '1' value labeled by version, revision, branch, and goversion from which query_exporter was built.
# TYPE query_exporter_build_info gauge
query_exporter_build_info{branch="",goversion="go1.16.5",revision="",version=""} 1
# HELP query_exporter_process_count_by_host process count by host
# TYPE query_exporter_process_count_by_host gauge
query_exporter_process_count_by_host{host="localhost",user="event_scheduler"} 1
query_exporter_process_count_by_host{host="localhost",user="test"} 1
# HELP query_exporter_process_count_by_user process count by user
# TYPE query_exporter_process_count_by_user gauge
query_exporter_process_count_by_user{user="event_scheduler"} 1
query_exporter_process_count_by_user{user="test"} 1
This is the moment when your own Exporter is created at final!. 🙂
Concluding..
The post was very long. I put the source code in the body several times.. I feel like the amount of text is getting longer.
Anyway, I’ve created my own unique Exporter! I implemented a simple function to simply register a query and extract this result as a metric result, but I think you can add more interesting elements according to your own thoughts as needed.
Sometimes, when I need to monitor hundreds and thousands of servers from one monitoring server, it is sometimes useful to manage the collection of metrics. As of yet, only support with MySQL, I personally create another Query Exporter project. I implemented more parallel processing and timeouts in the above project base. >> https://github.com/go-gywn/query-exporter
It’s always been like that… If there is nothing, just create and it If there is, use it well!
When servicing, we always have requirements about SEQUENCE. MySQL has auto_increment for each table by default, but it is difficult to satisfy all requirements in production.
In this situation, as in the blog content posted by Peter Zaitsev at the bottom, a sequence function is usually created and used. Of course, specifying InnoDB ensures stability in replication situations, not MyISAM.
Based on this content, let’s create the Function as below.
delimiter //
drop function nextval//
create function nextval(in_name varchar(100), in_type char(1)) returns bigint
begin
  declare date_format varchar(20);
  SET date_format = (
    case
      when in_type = 'M' then '%Y-%m-01 00:00:00'
      when in_type = 'D' then '%Y-%m-%d 00:00:00'
      when in_type = 'H' then '%Y-%m-%d %H:00:00'
      when in_type = 'I' then '%Y-%m-%d %H:%i:00'
      when in_type = 'S' then '%Y-%m-%d %H:%i:%S'
      else '%Y-%m-%d 00:00:00'
    end
  );
  insert into t_sequence (name, seq_num, mtime) values (in_name, last_insert_id(1), now(6))
      on duplicate key update
         seq_num = last_insert_id(if(mtime < date_format(now(6), date_format), 1, seq_num+1)),
         mtime = now(6);
  return last_insert_id();
end
//
delimiter ;
As shown in the Function function, M is reset every month, D is daily reset, H is reset every hour, etc.
Below is an example of resetting in minutes. (same example above)
Due to the structure of the function defined above, a lot of locks for a specific row occur. This means that network latency has a huge impact on query execution time, and it impacts directly on the duration of the lock time.
So, I simply tested it as follows LOCAL vs REMOTE, and results from local testing should probably be considered the best performance.
TEST1. Localhost
Using mysqlslap, let’s throw random traffic.
$ time mysqlslap -utest      \
  --password=test123         \
  --create-schema=test       \
  --iterations=1             \
  --number-of-queries=100000 \
  --query="select test.nextval('abc', 'H');"
mysqlslap: [Warning] Using a password on the command line interface can be insecure.
Benchmark
	Average number of seconds to run all queries: 5.979 seconds
	Minimum number of seconds to run all queries: 5.979 seconds
	Maximum number of seconds to run all queries: 5.979 seconds
	Number of clients running queries: 10
	Average number of queries per client: 10000
real	0m5.996s
user	0m0.915s
sys	0m1.709s
It was executed in 5.979 seconds, and 16,666 sequences were issued per second!! Not bad.
TEST2. Remote host
This time, let’s run it in an environment with some network latency. In my environment the latency is around 0.4ms.
$ ping 10.5.5.11
PING 10.5.5.11 (10.5.5.11): 56 data bytes
64 bytes from 10.5.5.11: icmp_seq=0 ttl=64 time=0.404 ms
I tried generating the same test traffic as above in this environment.
$ time mysqlslap -utest      \
  --password=test123         \
  --host=10.5.5.11           \
  --concurrency=10           \
  --create-schema=test       \
  --iterations=1             \
  --number-of-queries=100000 \
  --query="select test.nextval('abc', 'H');"
mysqlslap: [Warning] Using a password on the command line interface can be insecure.
Benchmark
	Average number of seconds to run all queries: 7.191 seconds
	Minimum number of seconds to run all queries: 7.191 seconds
	Maximum number of seconds to run all queries: 7.191 seconds
	Number of clients running queries: 10
	Average number of queries per client: 10000
was executed in 7.191 seconds, and 13,906 sequences were issued per second!! Not bad also.
But, if the network latency is higher than it is now, it will definitely show a worse figure. In any case, the sequence issuance performance itself seems to come out with an appropriate performance.
If a sequence is allocated individually, it seems that it can be used without worrying about performance or lock. (Test in which 10 users issue a sequence)
$ time mysqlslap -utest      \
  --password=test123         \
  --host=10.5.5.11           \
  --concurrency=10           \
  --create-schema=test       \
  --iterations=1             \
  --number-of-queries=100000 \
  --query="select test.nextval(concat('ab',floor(rand()*10)), 'H');"
mysqlslap: [Warning] Using a password on the command line interface can be insecure.
Benchmark
	Average number of seconds to run all queries: 5.702 seconds
	Minimum number of seconds to run all queries: 5.702 seconds
	Maximum number of seconds to run all queries: 5.702 seconds
	Number of clients running queries: 10
	Average number of queries per client: 10000
Conslusion
I started with the idea of making a sequence that doesn’t exist in MySQL to suit our service requirements in fun way.
Whether it’s a specific service or a personalized service… I’ve occasionally heard of a sequence requirement that starts from 1 at 0 o’clock.
In this case, in the existing case, it is necessary to lock and decide whether to process the reset with the current sequence value. Here, this was solved with a simple "INSERT INTO ON DUPLICATE UPDATE.."statement.
In a similar way, various functions can be created for your own service..
Over using MySQL, replication is you know not easy to away from it. It’s like saying that you have to manage multiple servers with the same data soon… It’s a lot of data recovery. This is especially true if the surer environment is in case of data explosion. In addition, the use of early morning backups during recovery will soon be a batch of changes that have been saved since dawn. This is a lot of time consuming data synchronization. In this environment, Simply talk about how to automate recovery.
Prepare
There is no big issue with “Linux+MySQL+Xtrabackup”.
CentOS 6.8
MySQL 5.7.14
Xtrabackup-2.4.3
Pv
Configured to replicate data based on an existing Binlog Position-based replication rather than GTID. I would take SCP for pull the data without any errors.
This means that you will soon have to pair the replication node with the id_rsa.pub key in advance so that you can pull the data without a password for authentication. That means you need to be prepared to access the server without a password.
Depending on the characteristics of the service or individual preferences. The most important thing is the recovery efficiency. Of course, there should be little service impact before efficiency. If so, I would say. You need to control your data transfer traffic. In general, if you have a recovery case, you can consider two cases.
A case that configures slaves with data from slaves. A case that adds another same slave to the current slave. The Slave Status information of the slave that is being dictated by the data becomes the configuration information for the recovery slave.
restore from master data
As a case to add slaves to the data of the master. The Binlog position of the server is the information for the slave configuration.
restore from slave data
A case that configures slaves with data from slaves. A case that adds another same slave to the current slave. The Slave Status information of the slave that is being dictated by the data becomes the configuration information for the recovery slave.
Before proceeding, It is shared the explains about automatic recovery scenario not for the my personal script. I had skip for explains that validation check or password crypt.
This is a data recovery advance knowledge. The bottom of xtrabackup read the manual first and I am sure it will be a great help.
https://www.percona.com/doc/percona-xtrabackup/2.4/howtos/setting_up_replication.html
case 1) restore from master data
As I told you earlier. I received the data from the master, as a case to configure slaves right at the bottom. A case that organizes data in the same way as the bottom image.
1) Pulling data
During the last course of Xtabackup… The process of copying non-InnoDB data… If you do not give the --no-lock option, you will perform a global Lock during the data copy to ensure the data consistency. In other words, it affects the service.
Fill out the innobackupex part directly into the shell and complete it in one room as shown below. Control the backup data that is sent to the streaming to “pv” (50 MB per second, make even weaker servers)…
You can view the two logs of “innobackupex.log” and “xbstream.log”” and validate the backup data that has been shown. The “innobackupex.log” is “completed OK!”, which would normally result in data being displayed.
2) Apply redo log
To proceed with the assumption that the advanced process has been performed normally. The process of applying data that has changed while the data is being backed up and transferred. This is also the end of the innobackupex.log “completed OK!” and you can see that the log has been applied normally.
innobackupex --apply-log . 2>> innobackupex.log
3) configuration of slave
Finally, The process of extracting the position of the master to configure the actual slave. The location information is extracted as follows from the “xtrabackup_binlog_pos_innodb” that is created after the Apply log. Usually, the master’s binary log position is recorded by a tab separated as shown below.
Now, the master server has also been determined, and the binary log position for the replication configuration is also defined. Let’s configure the slave as shown below.
echo "change master to
 master_host='${TARGET_HOST}',
 master_user='repl',
 master_password='replpass',
 master_log_file='${MASTER_LOG_FILE}',
 master_log_pos=${MASTER_LOG_POS};
 start slave;"\
| mysql -uroot -pxxxxxx
This is done by leveraging the master data as shown below without a large crowd to configure the new slave.
case 2) restore from slave data
Second case… Using data from the current slave server to add new slave servers. It has the following data flow: A scenario where you import data from a normally running slave server and configure additional slaves of the same topology based on the slave information for that slave.
1) pulling data
This time, the process of releasing backup streaming data from the slaves directly into xbstream, as well as throughput control to PV.
Specify the --slave-info option as shown below for the purpose of dictating the slave position differently than the previous case. (To give this option, record the slave state.)
Similarly, you can view the two logs of innobackupex.log and xbstream.log, and validate the backup data that has been available. In “innobackupex.log”, “Completed OK!” is the end of the data, and the xbstream.log result has been released properly with no content..
2) Apply redo log
While data is being backed up and transferred, it does the same as before to apply the changed data. This is also the end of the “innobackupex.log” “completed OK!” which is normally handled.
innobackupex --apply-log . 2>> innobackupex.log
3) configuration of slave
The slave position is now… I have to define a little differently from what I extracted from the master. You must first identify the binary log position in “xtrabackup_slave_info”.
Finally. The process of extracting the position of the master to configure the actual slave. The location information is extracted as follows from the “xtrabackup_binlog_info” that is created after the Apply log. Usually, the master’s binary log position is recorded by a tab separated as shown below. It is actually stored in the following form.
CHANGE MASTER TO MASTER_LOG_FILE='mysql-bin.000001', MASTER_LOG_POS=481
Getting a binary log position up here is a big move. The problem is, where do I get the information about the server that actually replication? Of course, this can be extracted from a separate monitoring tool. Or you can push the master information somewhere on a regular basis… The way I chose was to get into the target slave equipment that came with the data, look at the Slave Status directly, and retrieve the master server information that I am currently looking at.
One complaint.. When creating a "xtrabackup_binlog_info" file in xtrabackup, why not record the master information that the slave is looking at.
Now, the master server has also been recognized, and the binary log position for the replication configuration is also defined… Let's configure the slave as shown below. The master host (found earlier) has changed the actual master's host, not the target host.
echo "change master to
 master_host='${MASTER_HOST}',
 master_user='repl',
 master_password='replpass',
 master_log_file='${MASTER_LOG_FILE}',
 master_log_pos=${MASTER_LOG_POS};
 start slave;"\
| mysql -uroot -pxxxxxx
It is success to configuration with get data from slaves as follows.
Conclusion
So far, you’ve learned how to organize your slaves by leveraging the data. Before we start, we couldn’t show you all the scripts, just like you said. Of course, if only a few hundred lines, simple script but this cannot be the correct answer.
I don’t want to pull the data into the “scp”, but I can come through nc utility. Not a classic Binlog position… It’s even simpler to solve with GTID.
My solution is just one of a case not even more than that.
Have you ever thought about using “Affected Rows” in your application?
As you all know, “Affected Rows” is the number of data rows that actually affected by DML. It is usally used to check to see how many rows has been changed since DML(insert/update/delete) was executed.
In this post I would like to talk about how to use “Affected Rows” to solve various requirements in a fun way.
Affected rows in MySQL
As I mentioned before, “Affected Rows” in MySQL means the row that has really changed.
mysql> insert into test values (1,1);
Query OK, 1 row affected (0.00 sec)

mysql> update test set j = 1;
Query OK, 0 rows affected (0.01 sec)
Rows matched: 1 Changed: 0 Warnings: 0

mysql> update test set j = 2;
Query OK, 1 row affected (0.00 sec)
Rows matched: 1 Changed: 1 Warnings: 0
This looks nothing in your application, but if you think a little differently, you can get a free lunch, reducing amounts of queries. Let me explain about this. 🙂
Service requirements
If you have received the following requirements from the service planner:
Reset count every day at 00:00
Participate only 5 times in a certiain cycle
Normally, it would be implemented by bundling transactions as shown below.(This is just psudo code.)
try{
    execute("BEGIN");
    row = execute("SELECT * FROM user_event WHERE user_id = 100 FOR UPDATE");

    // 1. Check Time
    if(last_applied_time == CURRENT_DATE){

        // 2. Check Count
        if(apply_count < 5){
            execute("UPDATE user_event SET apply_count = apply_count + 1 WHERE user_id = 100");
        }
    }else{

        // 3. Reset Count
        execute("UPDATE user_event SET apply_count = 1 WHERE user_id = 100");
    }
    execute("COMMIT");
}catch(Exception e){
    execute("ROLLBACK");
}
Of course, this is not wrong, but I want to solve this service requirement more fun aspect with “affected rows”.
My own solution
Let’s create the following table before I explain it.
CREATE TABLE `user_event` (
  `user_id` int(11) NOT NULL,
  `apply_count` int(11) NOT NULL,
  `last_applied_time` timestamp NOT NULL DEFAULT CURRENT_TIMESTAMP ON UPDATE CURRENT_TIMESTAMP,
  PRIMARY KEY (`user_id`)
) ENGINE=InnoDB
It’s just a very simple table with an event apply count based on user with last event applied time (timestamp).Now, let’s create the query as shown below to suit planner’s requirements.
First, there must be no data, so we can make INSERT query as below.
INSERT INTO user_event (user_id, apply_count) VALUES (1, 1);
Second, let’s add more meaning to the query as follows to increase Count every time user participate event.
INSERT INTO user_event (user_id, apply_count) VALUES (1, 1)
    ON DUPLICATE KEY UPDATE apply_count = apply_count + 1
By the way, the planner order to initialize counter value every day.
If the last entry date is the same as today’s date, increase the apply_count. In order to satisfy a date requirement (1. Check Time), branch processing is performed by if as follows.
Let’s set the event participate limit condition as follows. The “apply_count” is only incremented when the current value is less than 5. So, we make the final query, as below.
Now, we solved these complex requirements in just a single line only. Then, let’s do some fun tests.:-)
I’m not a patient guy who could not wait some hours to change date 🙂 , so manipulated my code for changing a reset condition from daily change to every 10secs, as shown below.
And we can get the pretty results as below. Note that, the application can determine whether or not this user is applying (1 or more) or restricted (0) according to the Affected Rows value that is received in the query result.
1. First Insert
1 row affected means there’s no target rows in this table, so this is the first INSERT.
mysql> INSERT INTO user_event .. ON DUPLICATE KEY UPDATE ..
Query OK, 1 row affected (0.00 sec)

mysql> select * from user_event;
+---------+-------------+---------------------+
| user_id | apply_count |   last_applied_time |
+---------+-------------+---------------------+
|       1 |           1 | 2018-03-25 23:05:38 |
+---------+-------------+---------------------+
1 row in set (0.00 sec)
2. Second Insert in 10s
2 rows affected means, target row exists and row has been updated because of unique constraints. Does it make sense, so far?
mysql> INSERT INTO user_event .. ON DUPLICATE KEY UPDATE ..
Query OK, 2 rows affected (0.00 sec)

mysql> select * from user_event;
+---------+-------------+---------------------+
| user_id | apply_count |   last_applied_time |
+---------+-------------+---------------------+
|       1 |           2 | 2018-03-25 23:05:41 |
+---------+-------------+---------------------+
1 row in set (0.00 sec)
3. Insert more than 5 times
Affected rows are returned as 2, and 0 is returned after apply_count is 5.
mysql> INSERT INTO user_event .. ON DUPLICATE KEY UPDATE ..
Query OK, 0 rows affected (0.00 sec)

mysql> select * from user_event;
+---------+-------------+---------------------+
| user_id | apply_count |   last_applied_time |
+---------+-------------+---------------------+
|       1 |           5 | 2018-03-25 23:05:46 |
+---------+-------------+---------------------+
1 row in set (0.00 sec)
4. After 10 seconds
After 10 seconds the limited time, affected rows is returned to 2 and apply_count changed to 1. The meaning of affected rows is 2, regardless of whether initialization or increase, or whatever the user’s apply_count has been increased successfully.
mysql> INSERT INTO user_event .. ON DUPLICATE KEY UPDATE ..
Query OK, 2 rows affected (0.00 sec)

mysql> select * from user_event;
+---------+-------------+---------------------+
| user_id | apply_count |   last_applied_time |
+---------+-------------+---------------------+
|       1 |           1 | 2018-03-25 23:05:56 |
+---------+-------------+---------------------+
1 row in set (0.00 sec)
We don’t need to exectue another query to get the result, we can distinguish the result status and make variety message to users in application level. (No transaction, No several queries, Just 1 Query, Free lunch box)
In other words, to summarize, the following behavior can be expected.
If there are no changes to the data, then there is only 0 Affected Rows. This feature is depended on the DBMS, it is also (probably) dependent on MySQL.
However, if you understand and use these behaviors, you can solve some kind of problems of getting more comfortable. In addition to limiting the number of event “apply count” for a certain period of time, it may be also necessary to keep “summarized data” on a daily or monthly basis. If you think about it, you can easily implement an initialized sequence using affected rows. There is already something that I made roughly, but I will arrange it next time.
First posting in English, it’s so tough.
Thanks, have a nice day~ 🙂