Overview
I mentioned about PMM(Percona Monitoring and Management), actually I will talk about using Prometheus query and Grafana with little trick. It’s how to express read-only ON/OFF clearly in grafana. 🙂
Definition
This topic is in the server notation according to the READ-ONLY setting value of MySQL, but in my opinion this is also a topic that separates the master/slave. Of course, you can also run a service with a different topology of MySQL, such as (M)-(M/S)-(S) as a body-dining structure. I think that the simplest configuration is the most powerful, when you prepare for a variety of disabilities with personal thought. In my position, READ-ONLY is defined as slave, a guy activated ON.
- Master (READ_ONLY: OFF)
An instance for subject of data change
Master recognition for (M/S) with middle chaining like (M)-(M/S)-(S)- Slave (READ_ONLY: OFF)
Instances that data cannot be changed
A query may differ depending on the individual’s definition, but I want to have representation of the “READ_ONLY is based on ON/OFF server Classification” or “all instance criteria.”
Grafana Variable
In MySQL, READ-ONLY means only ON/OFF, but here we have added a value of 2 to mean the entire server.
- var_read_only : 0 (READ-ONLY OFF)
- var_read_only : 1 (READ-ONLY ON)
- var_read_only : 2 (ALL)
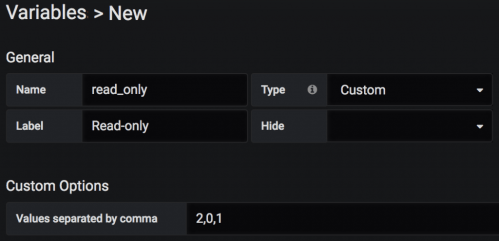
How to add a new Variable from Grafana is to be added in the Variables tab of the Setting of the dashboard, and the custom type as shown below 2, 0, 1. The reason why start with 2. Just try to specify the default value.
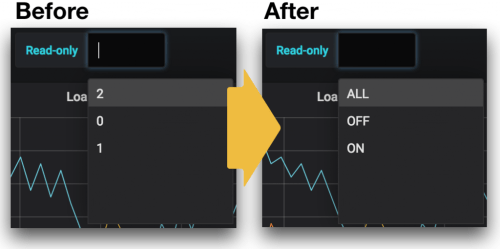
However, the problem is that if you look at the Variable select box created, the notation is shown as 2, 0, 1 and is not intuitive. 2-> ALL, 0-> OFF, 1-> ON to be represented in the Select box, it would be okay to be used? (Of course, no matter to use.)
In the UI setting of Grafana, it seems to be impossible (yet)… This requires a little manipulation and re-Import after the Export of Grafana. Look up “Share Dashboard” > “Export” tab and open it up as a JSON file, the “text” part is also set to something like value, as shown below.
{
  "allValue": null,
  "current": {
    "text": "2", <== here
    "value": "2"
  },
  "hide": 0,
  "includeAll": false,
  "label": "Read-only",
  "multi": false,
  "name": "read_only",
  "options": [
    {
      "selected": true,
      "text": "2",
      "value": "2"
    },
    {
      "selected": false,
      "text": "0", <== here
      "value": "0"
    },
    {
      "selected": false,
      "text": "1", <== here
      "value": "1"
    }
  ],
  "query": "2,0,1",
  "type": "custom"
}
The above text will be replaced with an intuitive phrase as below, and you can Import the Dashboard again.
{
  "allValue": null,
  "current": {
    "text": "ALL", <== here
    "value": "2"
  },
  "hide": 0,
  "includeAll": false,
  "label": "Read-only",
  "multi": false,
  "name": "read_only",
  "options": [
    {
      "selected": true,
      "text": "ALL", <== here
      "value": "2"
    },
    {
      "selected": false,
      "text": "OFF", <== here
      "value": "0"
    },
    {
      "selected": false,
      "text": "ON", <== here
      "value": "1"
    }
  ],
  "query": "2,0,1",
  "type": "custom"
}
Finally, it is possible to make intuitive phrases on the Grafana screen. It is not easy to control and anyway the first query setting is completed!
Promethues Query
At Grafana, we’ve created the basis to deliver whatever you want, and this time we’ll write a Prometheus query to look at the data. In this place, I will not explain the Prometheus query every one, please visit the official site manual once Prometheus, read the query syntax. (Here)
My concern is the grouping result of the READ-ONLY ON/OFF. In the preceding definition, if the READ_ONLY value is 0, the master, the READ_ONLY is 1, the slave, and 2 means the entire server. Based on this data from Grafana, we will select and take only the data that we want.
First, try extracting the current system load with a Prometheus query to get a maximum value of one minute for max_over_time, as shown below. This is the result corresponding to the entire instance.
max_over_time(node_load1[1m])
Add a condition for the READ-ONLY status value to look up the results for READ-ONLY on/OFF. Here, the “on” entry means to process data operations based on which data, if it is a SQL reference, it’s probably the JOIN condition.
max_over_time(node_load1[1m])
  and on (instance) (mysql_global_variables_read_only == $read_only)
But there’s one problem here. If the READ-ONLY value exists, it will query queries without a big problem, but if you look up master/slave at the same time, like a entire server, the query does not work normally.
So, here is the another trick for it. If the result of the three values is equal to 1 or more than 2, then it seems to be resolved? And if we tie the “OR” condition, we can do the first arithmetic process, and if we do not meet, we will write a query to READ-ONLY part? The metric that “exists unconditionally” in each instance is ?
You can use the value “up {job = ‘ Linux ‘}”. The result of this value is 0 or 1, and you can assume that the Exporter exists unconditionally. In other words, if the $read _oly is 0 and 1, it will be negative, and you can create a query as shown below that it will only have 1 or more positive values.
max_over_time(node_load1[1m])
  and on (instance) (
      up{job='linux'} <= $read_only^2-3
      or mysql_global_variables_read_only == $read_only
  )
If this is the case, the first 2 is filtered in the first up condition and does not refer to the mysql_global_variables_read_only portion of the back. (Or does not have the preceding result) However, if the READ_ONLY filtering condition enters zero or one operation, the up result does not exist, so you can check the Mysql_global_variables_read_only value and finally extract the data with desired.
Result
I configured the VM locally as a test and set up the MySQL server with the following structure, and then I tried to float the PMM exporter. Set the OFF for read only because of node01 and node03 are the role of the main for data change.
node01 : Master
  ㄴ node02 : Slave
node03:  Master(Single)
Case1. ALL Instance
All servers are displayed, including Pmm-server instances.

Case2. READ-ONLY: OFF
As intended, only instances where the READ-ONLY is OFF are shown in the graph. Note that only MySQL instance data with the READ-ONLY property is indicate, so the Pmm-server instance will fall out of the target list.
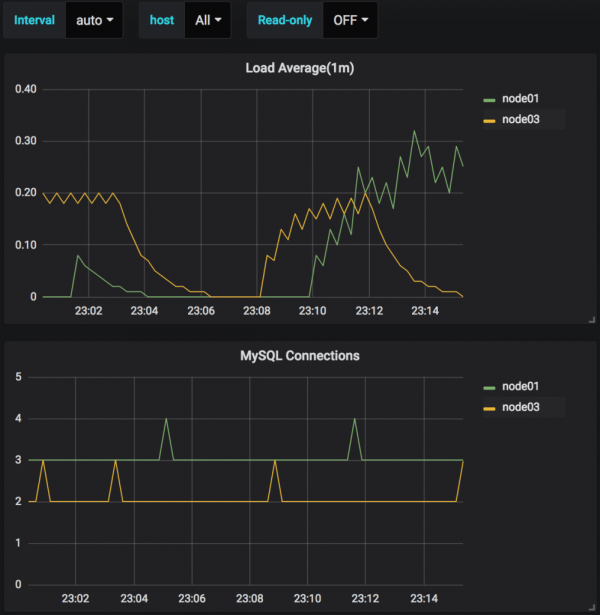
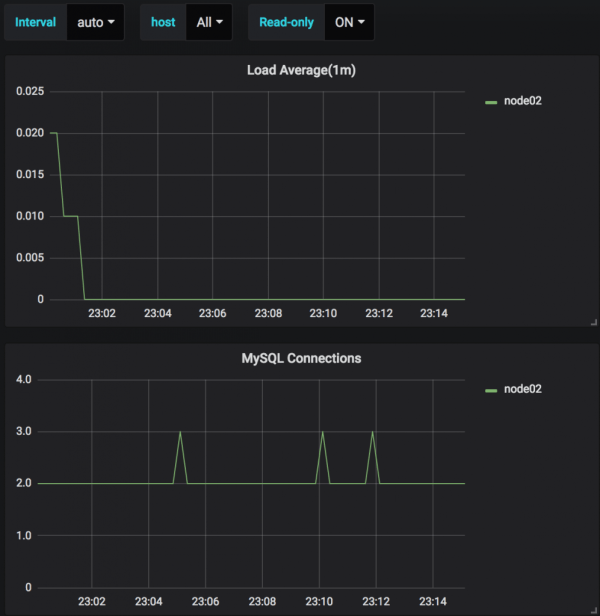
Case3. READ-ONLY: ON
Finally, The READ-ONLY only shows the slaves that are ON. Here is the same with no pmm-server.
Conclusion
Here is the what I did
Intuitively notation for READ-ONLY with trick for dashboard Import in Grafana
Create Prometheus tips and tricks to filter by two steps (ALL, READ-ONLY ON/OFF)
It can be very simple and easy for master hand, but if you have to get resource status on system at a glace with dozens of master/slave mixed environments, the sorting according to the rolls can be a big deal.
However, since the criteria of this notation depends on the database READ-ONLY, another notation is necessary if the DB is not running. I think it is a good idea to solve this problem through the recording function in Prometheus.
Good luck~ 🙂