I personally believe that reliable service starts with monitoring and ends with tuning.
PMM is a very useful monitoring tool. I believe super stable service is mostly coming from Service Monitoring.
Anyway, when I first saw PMM, I was very impressing because I was thirsty for customizing of Database monitoring solution. However, while deeply analyzing the structure and function of the PMM, I found out that there are some features of motoring solution that need to have additional features.
Why Monitoring Feature is so important?
The monitoring system aims to show the current indicators or status of database properly. In this respect, I would like give PMM with good score.
However, it is also a very important monitoring feature to send alerting to the administrator when the problem occurs (or before).
The problem was that there was no effective solution with PMM, and I needed that my banking service should be running without any further problems.
PMM Alerting
As you know, there are two ways you can send Alerting in PMM.
The first is to take advantage of Grafana’s Alerting feature.
You can control from UI interface and it’s intuitive.
https://www.percona.com/blog/2017/01/23/mysql-and-mongodb-alerting-with-pmm-and-grafana/
https://www.percona.com/blog/2017/02/02/pmm-alerting-with-grafana-working-with-templated-dashboards/
Unfortunately, Grafana does not support “Template Variable” properly, so I should set the number of alerting for each metric. This is a tired and not a suitable solution for the expansion of hundreds of nodes.
The second is to use “alert rule” of prometheus.
Though not intuitive, it is a way to specify multiple node thresholds at once.
https://prometheus.io/docs/prometheus/latest/configuration/alerting_rules/
However, there’s no way to set dynamic thresold for each node, only supports a fixed.
Even though I want to specify different thresholds for the purpose of the server(ex, production/development), there is no way to configure the alert rule without complicated alerting rule configuration in prometheus.
PMM-ruled
I do need a “dynamic rule manager”, so I made this with a funny idea.
Grafana alerting which I said before that was difficult to apply, so I decided the second method, prometheus alerting. As I mentioned a little while ago, promethus is a time series database. In order to perform data operations, the data to be computed and must exist in the same time range.

In other words, in order to configure the threshold value of each server differently, this threshold value is also periodically taken from the prometheus as some kind of metrics.
PMM-ruled is the Alerting threshold exporter.
It is not enough. There must be a principal to manage these alerting rules. If you want to set A node and B node need to receive alerting message when CPU usage is over 10%, 20% in each, this information also must be stored and managed somewhere else.
From the perspective of monitoring for dozens and hundreds of nodes with a single PMM, I did not want to manage the file thresholds one by one manually, one by one. (In fact it is impossible to handle by myself.)
Alert thresholds must be managed with “group” or “instance” in each. And I would like to have the ability to skip alerting as well.
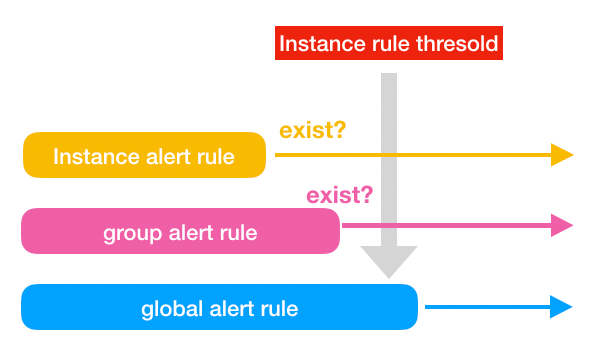
If an instance level rule exists, it is given priority for that instance. If there is no instance level rule, priority is given to the group rule. If neither instance nor group has a specified threshold, use the threshold specified in alert rule for that node. The threshold values are classified into layers, like the image above
PMM-ruled is the alerting rule managing API server.
And if the alert rule was defined as a fixed value it would be shown as below:
groups:
- name: alert_rules
  rules:
  - alert: mysql_agent_up
    expr:  up{job="mysql"} == 0
    for: 10s
    labels:
      level: critical
    annotations:
      summary: MySQL Agent Down
      description: MySQL Agent Down
The thresholds can be calculated as a single metric and managed dynamically on a server basis as shown below.
groups:
- name: alert_rules
  rules:
  - alert: mysql_agent_up
    expr:  up{job="mysql"} == on (instance) group_left (level, name, gname) (alert_rule_threshold{name="mysql_agent_up", level="critical"})
    for: 10s
    labels:
      level: critical
    annotations:
      summary: MySQL Agent Down
      description: MySQL Agent Down
PMM-ruled is the alerting rule file generator.
In addition to this, it has more features such as prometheus recording rule management, snapshot rule management which inserts current state value into MySQL. (to show current node status with just single table.)
The figure below is showing the configuration of the whole pmm-ruled.

Interesting?
I made this feature in April, 2018, and am still monitoring for dozens of mysql nodes with only single PMM server from that time. I’m currently collaborating with Percona after contributing the entire pmm-ruled source code.
You can start this project from percona-lab repository.
I would like to keep the original source, so I forked into a separate project.
I will talk about how to port from pmm-ruled to pmm in the next time.
Thanks.
